Customizing the Dashboard
The dashboard ships with twelve widgets turned on. If you only care about a few of them, use the Customize button to hide the rest. Your choice is saved to your own account and applies on every plan, including the free Monitor tier.
Opening the Customize sheet
Quick steps
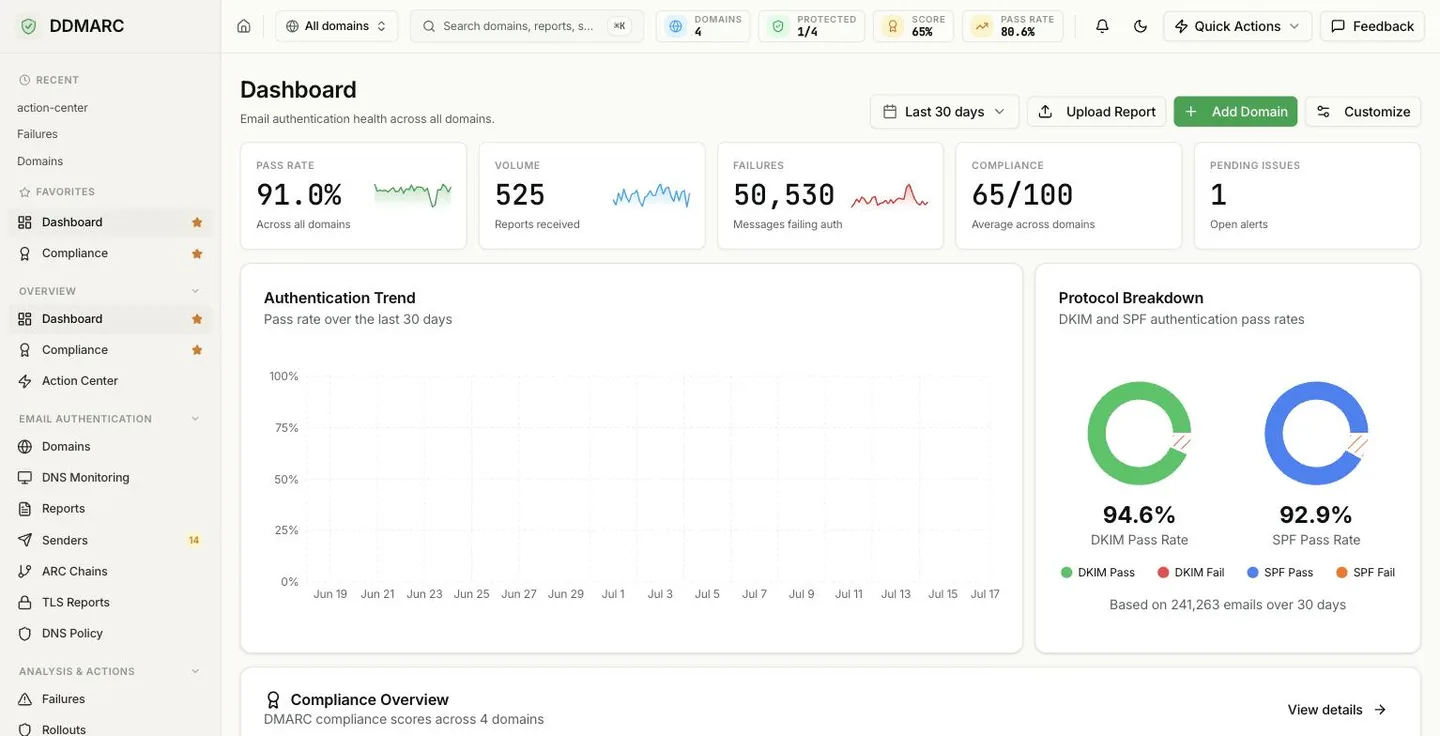
Open the Dashboard page. The header carries a date-range picker, Upload Report, Add Domain, and Customize.
Click Customize. A side sheet titled “Customize Dashboard” slides in with one row per widget.
Toggle any widget off to remove it from the page, or back on to bring it back. The dashboard behind the sheet updates as you go.
How customization behaves
Show or hide, nothing else
Each widget has a single toggle. Hiding a widget only removes it from your view — it never stops data collection or affects your score.
Saved automatically
There is no Save button. Every toggle is written to your account as soon as you flip it, so your layout survives a reload or a new device.
Reset to Default
One button at the bottom of the sheet restores all twelve widgets to visible, in their original order.
Widget order is fixed
The dashboard uses a curated multi-column layout, so widgets cannot be dragged into a new order — visible widgets always appear in the same sequence. Customization is show/hide only.
Widgets you can toggle
These are the twelve widgets in the Customize sheet, in the order they appear on the page. All of them are visible by default.
Available widgets
Stats Overview
The KPI row: Pass Rate, Volume, Failures, Compliance, Pending Issues
Authentication Trend
Pass and fail volume over the selected date range
Protocol Breakdown
DKIM and SPF pass-rate donuts
Failure Breakdown
Why messages failed — SPF, DKIM, and alignment
DMARC Policy Status
How many domains sit at none, quarantine, and reject
Sender Overview
Top sending services and their authentication status
Recent Alerts
The latest alerts raised across your domains
Time-of-Day Patterns
Heatmap of sending volume by hour and weekday
Top Email Sources
Highest-volume source IPs and networks
Period Comparison
This period versus the previous one
Geographic Distribution
Where mail claiming your domain is sent from
Recent Reports
The most recently ingested aggregate reports
A few sections of the Dashboard page are always shown and are not part of the sheet — the onboarding checklist for a brand-new account, the Compliance Overview scorecard, and the failure trend card.
Who your layout applies to
Per user, not per organization
Preferences are stored against your user account. Everyone on your team can hide a different set of widgets without affecting anyone else's view.
No plan gate
Dashboard customization is not a paid feature. Monitor, Protect, Growth, Professional, Enterprise, and Partner accounts all get the full Customize sheet.