Alerts & Notifications
DDMARC raises an alert when your authentication posture changes — failures spike, a new sender appears, a DNS record disappears, or a rollout stalls. This page covers what can fire, where it lands, and how to keep the noise down.
The Notifications center
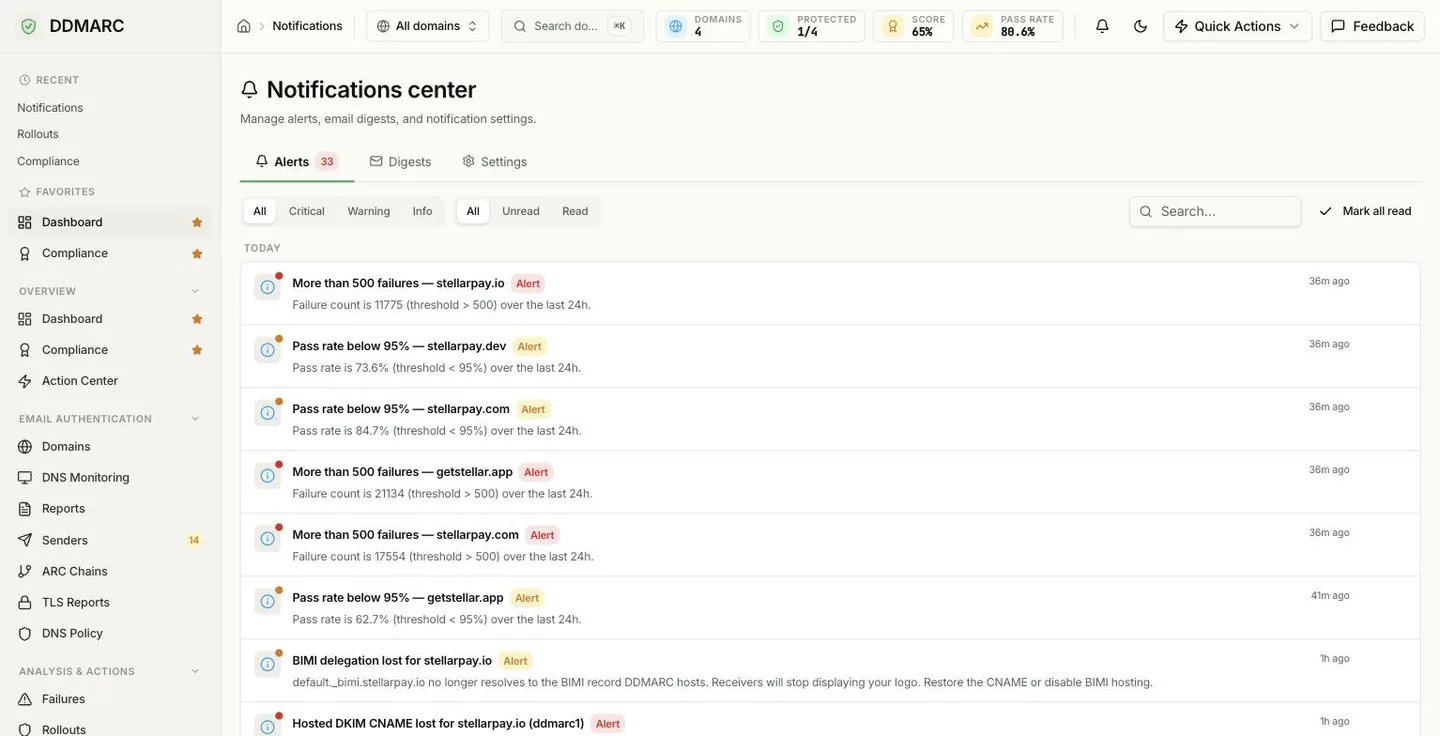
Alerts live at Dashboard → Notifications, which has three tabs:
Alerts
Every alert raised for your organization, newest first and grouped by day. Filter by severity (Critical / Warning / Info) and by read or unread, search the text, or hit Mark all read.
Digests
Your daily or weekly summary email — preview it, send yourself a test, and choose which sections it contains.
Settings
Which alert types you receive, your thresholds, and every delivery channel.
What can raise an alert
Authentication failures
- DMARC failure
- SPF failure
- DKIM failure
- High failure rate (default: above 20% of mail)
Sending sources
- New sender detected
- Forensic report spike (default: 5 reports in 24 hours)
- Lookalike / typosquat domain found
DNS
- DNS record changed
- DNS record regressed (was valid, now is not)
- DNS record recovered
- General DNS issue
Policy and rollouts
- DMARC policy published to DNS
- Rollout started
- Rollout stage advanced
- Rollout blocked
- Rollout completed
Managed hosting health
- Hosted SPF refresh failed or delegation lost
- Hosted DKIM CNAME lost, or signing key ageing
- Managed MTA-STS delegation lost or serving broken
- Managed BIMI delegation lost
Reports and custom rules
- New report received (off by default — high volume)
- Custom alert rule triggered
Managed-hosting alerts only fire for services you have actually enabled on a domain. Everything except "new report received" is on by default; you can turn individual types off in Notifications → Settings.
Severity
Every alert carries one of three severities. Severity drives the filters in the Notifications center, the color and emoji used in Teams and Telegram messages, the Jira priority when you create a ticket, and the per-domain minimum-severity threshold.
Critical
Something is actively broken or being abused — act now.
Warning
A degradation worth investigating before it becomes an outage.
Info
Something changed and you should know about it. No action implied.
Delivery channels
Configure these in Notifications → Settings. Each channel has a Send test button so you can confirm delivery before an incident depends on it.
Delivered to your account address. On by default for every user.
Notifications → Settings
Webhook
POSTs the alert to any HTTPS endpoint. Paste a Slack or Discord incoming-webhook URL and DDMARC formats the message for that platform automatically.
Notifications → Settings → Webhook URL
Microsoft Teams
Posts an adaptive card to a Teams channel via an incoming webhook.
Notifications → Settings → Teams webhook URL
Telegram
Sends a message through your own bot. Needs a bot token and chat ID.
Notifications → Settings → Telegram
Jira
Creates a ticket from a specific alert on demand — it is not an automatic delivery channel. Severity maps to issue priority.
Notifications → Settings → Jira, then use Create ticket on an alert
Slack and Discord are not separate channels. Paste an incoming-webhook URL from either platform into the single Webhook field — DDMARC recognizes the URL and formats the payload for that platform. Any other URL receives a plain JSON POST. Webhook requests are sent with SSRF protection and do not follow redirects, so the destination must be a public HTTPS endpoint.
Configuring your alerts
Open the Settings tab
Alert preferences are not in account Settings — they live inside the Notifications page.
Dashboard → Notifications → SettingsToggle alert types and set thresholds
Two alert types have numeric thresholds you control:
| Alert | Threshold | Default |
|---|---|---|
| High failure rate | Percentage of mail failing DMARC | 20% |
| Forensic spike | Number of forensic reports within a rolling window | 5 reports / 24 hours |
For anything else — pass rate, SPF or DKIM failure rate, volume change, new senders, DNS changes — create a custom alert rule with your own metric, operator and threshold.
Choose immediate or digest delivery
Email delivery runs in one of three modes:
Immediate
Each alert is emailed as it fires.
Daily digest
One summary per day at an hour you pick (UTC).
Weekly digest
One summary per week at the same chosen hour.
Digests are configurable: include or exclude the stats, protocol, domain, sender, failure and alert sections, and restrict them to specific domains. Preview or send yourself a test from the Digests tab.
Tune individual domains
Each domain has its own Notifications tab with three controls: email notifications on or off, weekly digest on or off, and a minimum severity threshold. Set a noisy staging domain to Critical only and it stops filling your inbox without disabling anything organization-wide.
Working through alerts
Read / unread
Alerts arrive unread. Mark one read, or clear the whole list with Mark all read.
Snooze
Silence an alert until a chosen time — useful during a planned DNS migration. Snooze many at once with bulk snooze.
Create a Jira ticket
Push a single alert into your Jira project with the severity mapped to a priority.
Alerts API
| Endpoint | Purpose |
|---|---|
| GET /api/v1/alerts | List alerts for your organization |
| POST /api/v1/alerts/{alert_id}/read | Mark one alert read |
| POST /api/v1/alerts/read-all | Mark every alert read |
| PATCH /api/v1/alerts/{alert_id}/snooze | Snooze one alert until a timestamp |
| POST /api/v1/alerts/bulk-snooze | Snooze several alerts at once |
| GET|PATCH /api/v1/alerts/preferences | Read or update alert preferences |
| GET|POST /api/v1/alerts/rules | List or create custom alert rules |
| POST /api/v1/alerts/webhook/test | Send a test alert to your webhook |
| POST /api/v1/alerts/teams/test | Send a test alert to Microsoft Teams |
| POST /api/v1/alerts/telegram/test | Send a test alert to Telegram |
| POST /api/v1/alerts/email/test | Send yourself a test alert email |
| POST /api/v1/alerts/jira/test | Verify your Jira credentials |
Not available yet
Not available yet — Quiet hours
There is no schedule that suppresses alerts outside working hours. To reduce out-of-hours noise, switch email delivery to a daily digest at an hour that suits you, raise the per-domain severity threshold, or lengthen the cooldown on your custom rules.
Not available yet — Hourly digests and push notifications
Digests are daily or weekly only — there is no hourly option — and DDMARC does not send mobile push notifications. Use a webhook, Slack, Teams, Discord or Telegram if you need something faster than a daily email.
Best practices
- Send a test message on every channel the day you configure it, not the day you need it.
- Start with the default thresholds for a couple of weeks, then tighten them once you know your normal failure rate.
- Route critical alerts to a shared channel the team watches and leave informational ones to the daily digest.
- Snooze instead of disabling during planned DNS work, so the alert comes back automatically afterwards.
Avoiding alert fatigue
Too many alerts and the important one gets ignored. The levers that actually exist:
- • Raise the cooldown on custom rules so a persistent condition alerts once, not every evaluation.
- • Raise the per-domain minimum severity on low-stakes domains.
- • Move informational types to the daily or weekly digest.
- • Leave "new report received" off — it fires on every inbound report.
- • Turn off alert types you have never once acted on.