Dashboard Guide
A tour of the DDMARC dashboard — where each page lives, what the Overview widgets are telling you, and which features come with which plan.
Navigation
The sidebar is organized into four groups. Management is collapsed by default; Lookalike Domains and Team appear once your plan includes them. Partner (MSP) accounts get an additional block for customers, prospect scanning, billing, and branding.
Overview
- Dashboard — KPI row, trends, and widgets across every domain
- Compliance — Per-domain scores, grades, and recommendations
- Action Center — Prioritized list of what to fix next
Email Authentication
- Domains — Add domains, check DNS, and open a domain workspace
- DNS Monitoring — Record checks, history, and change alerts
- Reports — Every aggregate (RUA) report received
- Senders — Sending services and IPs, categorized
- ARC Chains — Authenticated Received Chain results for forwarded mail
- TLS Reports — TLS-RPT delivery and negotiation failures
- DNS Policy — Current policy posture per domain
Analysis & Actions
- Failures — Failure Analysis: root causes, spoof clusters, fixes
- Rollouts — Staged policy rollouts from none to reject
- Notifications — Alerts, alert rules, and delivery channels
- Lookalike Domains — Brand-protection scanning for confusable domains
Management
- Activity — Audit trail of who changed what
- Exports — CSV exports of reports, senders, and activity
- Team — Invite teammates and manage roles
- Settings — Organization, billing, and account settings
Command palette
Press Cmd +K (or Ctrl + K) to jump to any page by name. Some destinations — Forensic Reports in particular — are not in the sidebar and are reached from the palette, from the Failures page, or from a breadcrumb.
The Dashboard page
Your landing page after login. The header carries a date-range picker, and buttons for Upload Report, Add Domain, and Customize. A brand-new account sees a setup wizard here instead until the first report arrives.
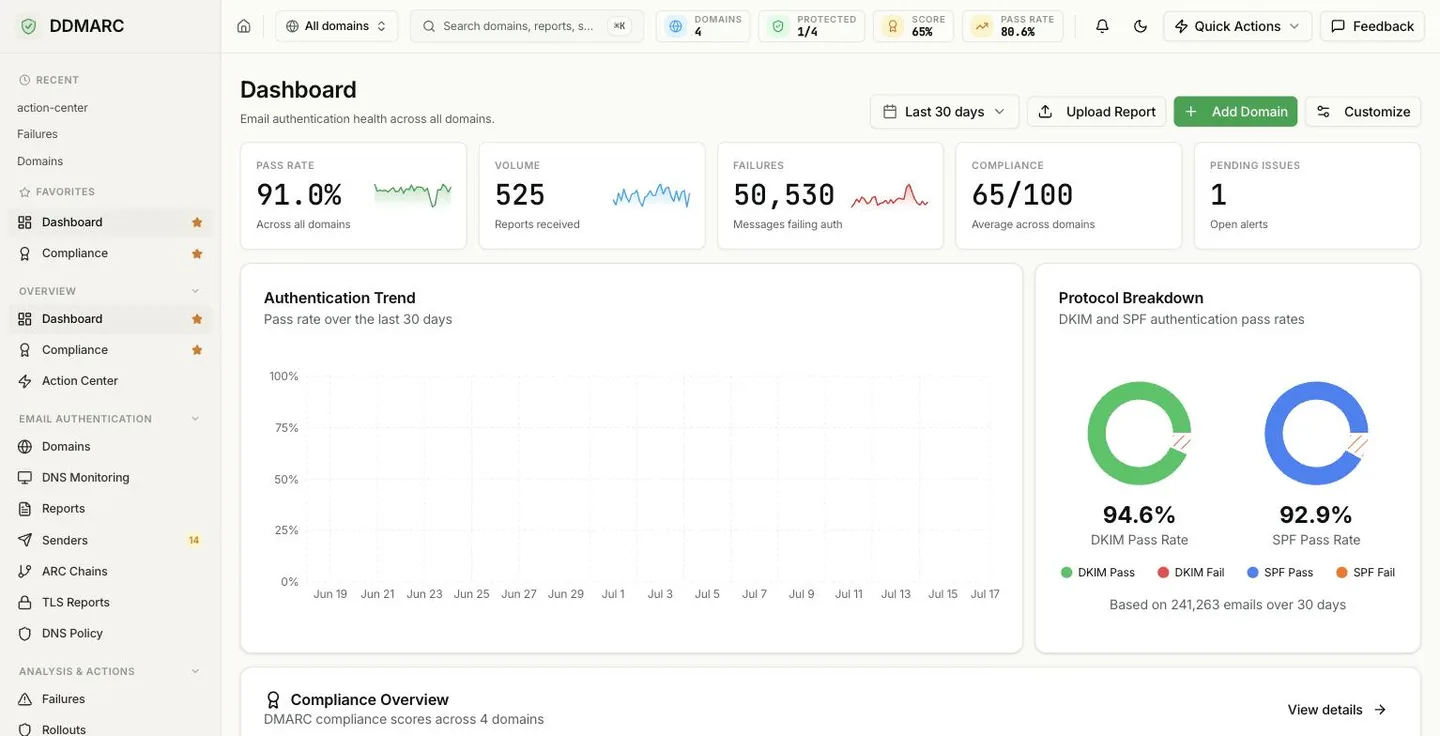
KPI tiles
| Tile | Shows |
|---|---|
| Pass Rate | DMARC pass rate across all domains, with trend and sparkline |
| Volume | Reports received in the selected period, with trend |
| Failures | Messages failing authentication — links to Failure Analysis |
| Compliance | Average compliance score out of 100 across your domains |
| Pending Issues | Open alerts awaiting attention |
Widgets below the KPI row
- Authentication Trend — pass and fail volume over time
- Protocol Breakdown — DKIM and SPF pass-rate donuts
- Compliance Overview — grade distribution and the domains needing attention
- Failure Trend and Failure Breakdown
- DMARC Policy Status — domains at none, quarantine, reject
- Sender Overview — top sending services
- Recent Alerts and Recent Reports
- Time-of-Day Patterns heatmap
- Top Email Sources
- Period Comparison
- Geographic Distribution
Any of these can be hidden from the Customize sheet — see Customizing the Dashboard.
Reports
Every aggregate (RUA) report DDMARC has received, newest first, with three KPI tiles above the table: Total Reports, Total Emails, and Pass Rate.
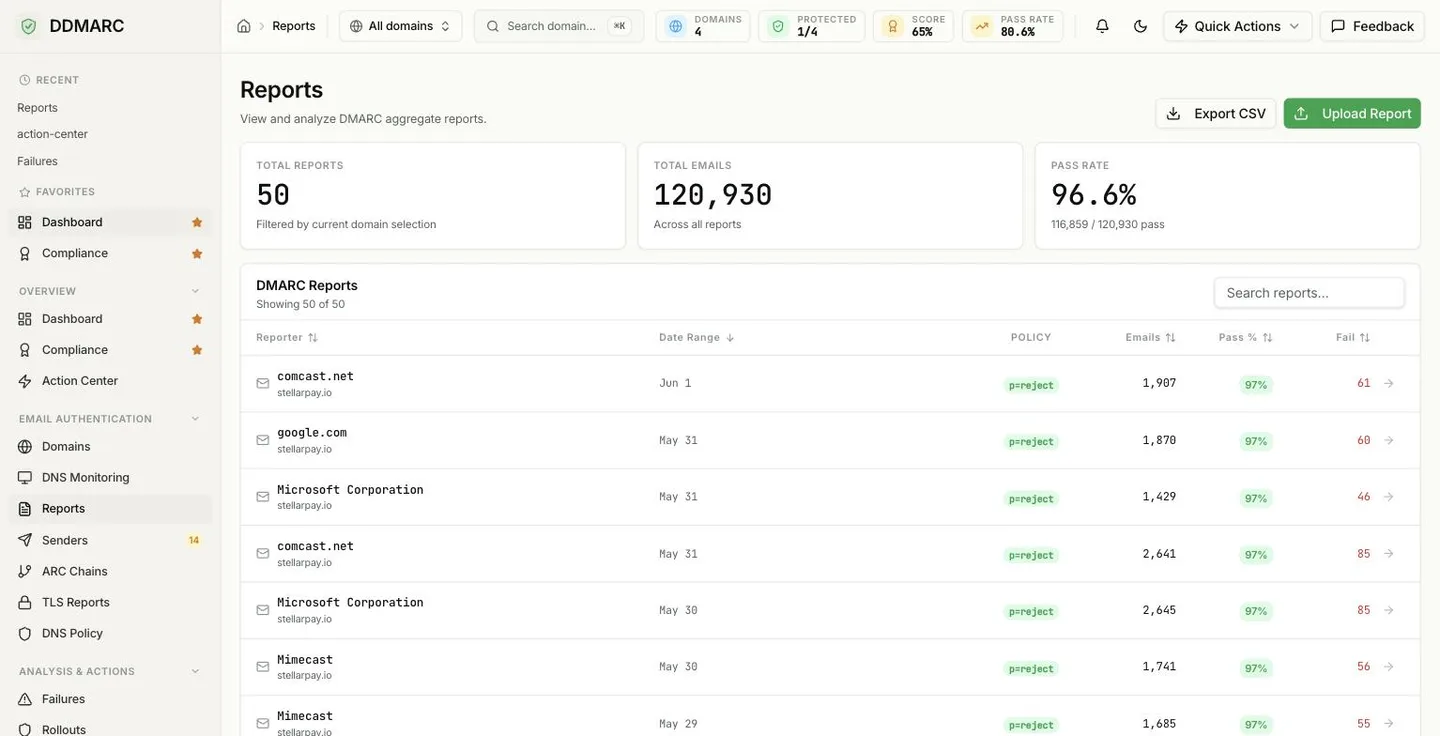
Report list columns
| Column | Description |
|---|---|
| Reporter | Organization that sent the report, with the domain it covers underneath |
| Date Range | Period covered by the report (usually 24 hours) |
| Policy | The policy that was published when the report was generated |
| Emails | Number of messages in the report |
| Pass % | Share of messages passing DMARC, color-coded |
| Fail | Messages that failed DMARC |
Report details
Click any row to see the per-source breakdown: source IP, country, ASN, SPF and DKIM results, alignment, and the disposition applied. See Reading Reports for how to interpret it.
Domains
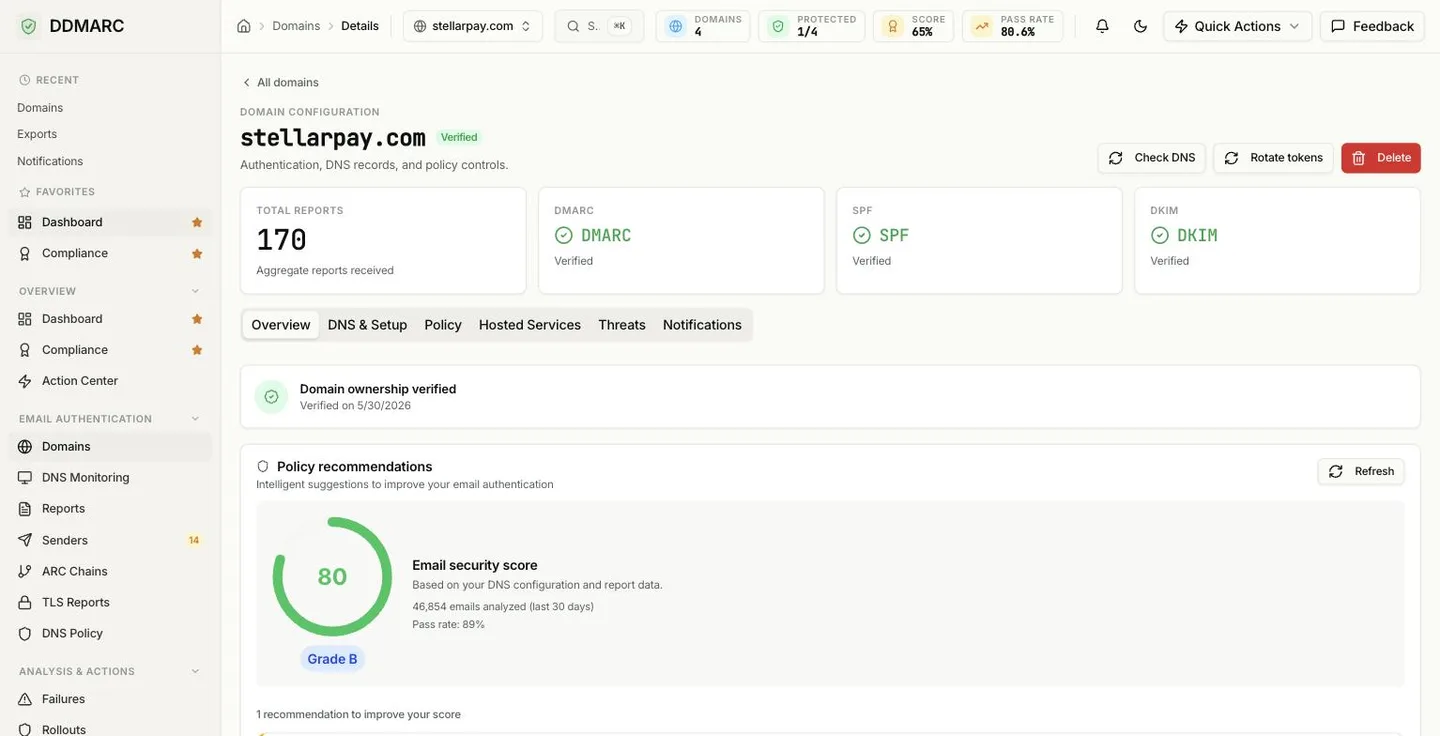
The Domains page lists every monitored domain with its verification state, DMARC policy, pass rate, and DNS health card — including the advisory DNSSEC and DANE panels. Click a domain to open its workspace.
Domain list
Add and remove domains, run a DNS check, and see health at a glance. Your plan sets the domain limit.
DNS & Setup tab
Copy-paste ready TXT records for SPF, DKIM, DMARC, and optional MTA-STS and BIMI — including the RUA and RUF addresses unique to that domain.
Domain workspace tabs
- Overview — traffic, pass rate, and health for this domain
- DNS & Setup — the records to publish, plus verification
- Policy — current policy and how to tighten it
- Hosted Services — managed MTA-STS, BIMI, and DKIM hosting
- Threats — spoofing and lookalike signals for this domain
- Notifications — per-domain alert settings
Senders
Every service and IP that has sent mail claiming your domain, with pass rates and remediation guidance. Full detail in the Senders guide.
Authenticating senders
Sources passing SPF or DKIM with alignment. These are your legitimate mail streams.
Failing senders
Sources failing authentication — either spoofing, or a real service missing SPF/DKIM setup. The Failures page tells you which.
Sender categories
Every sender carries one of seven categories. New senders start as Unknown until you classify them.
Failures
The Failures page is where you diagnose authentication problems, not just count them. It classifies root causes, groups likely spoofing campaigns, and links each cause back to the sender that caused it.
Root cause analysis
Failures grouped by cause, each with a suggested fix and links to the senders involved
Spoof campaign clusters
Related failures grouped by IP range, From: domain, and week
Most-spoofed domains
Which header-From domains attackers are impersonating
Time to resolution
How long DNS misconfigurations take you to fix, derived from monitoring checks
Read the full walkthrough in Failure Analysis.
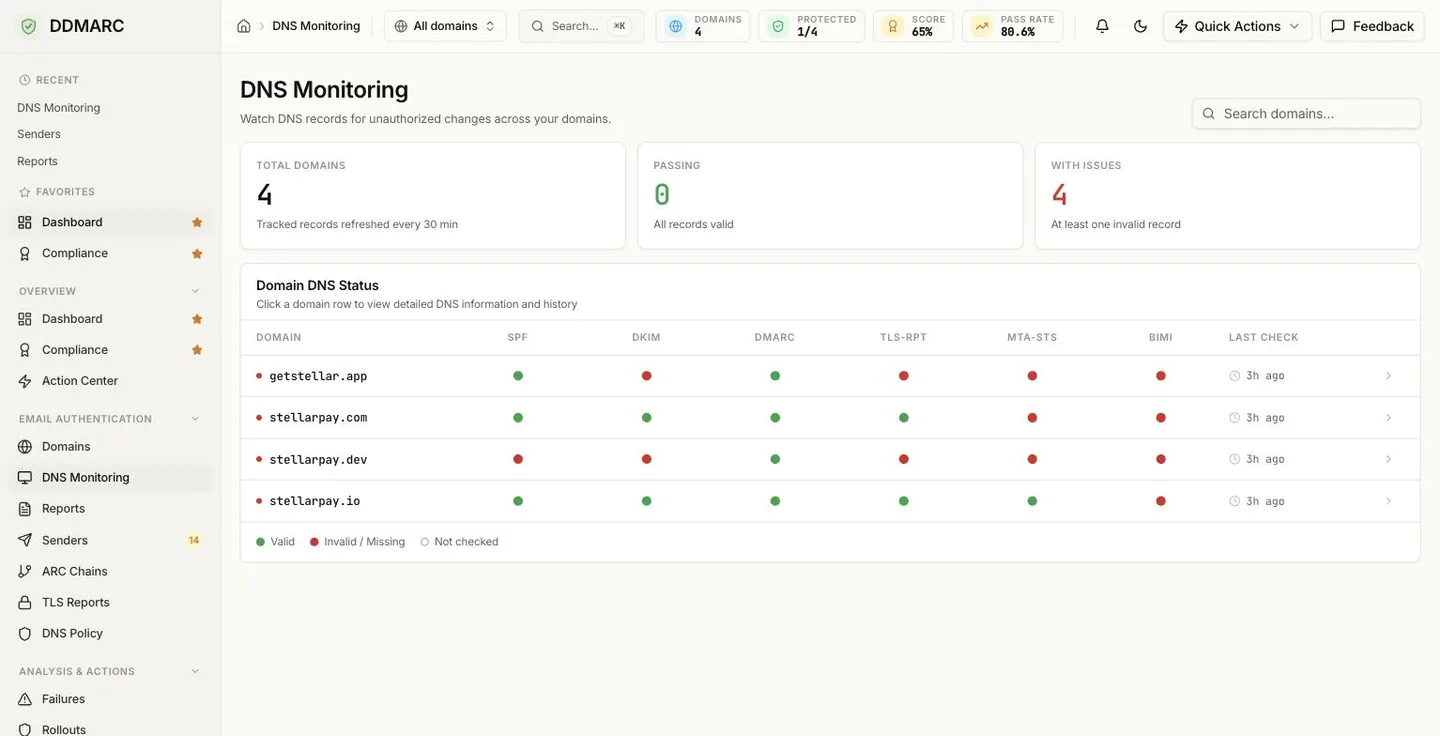
DNS Monitoring
Six record types are checked and scored. Two more are collected as advisory information.
Monitored records
| Record | Purpose | Availability |
|---|---|---|
| SPF | Authorize mail servers to send on your behalf | Monitor+ |
| DKIM | Cryptographically sign emails for authenticity | Monitor+ |
| DMARC | Define policy for handling authentication failures | Monitor+ |
| TLS-RPT | Receive TLS connection failure reports | Protect+ |
| MTA-STS | Enforce TLS encryption for inbound email | Protect+ |
| BIMI | Display brand logo in email clients | Protect+ |
| DNSSEC | Signed DNS responses — reported, never scored | Advisory |
| DANE / TLSA | Certificate pinning for SMTP, with live cert match — reported, never scored | Advisory |
Advisory means advisory
DNSSEC and DANE/TLSA results carry an Advisory badge on the domain health card. They are worth zero points and can never raise or lower your grade — see Security Score.
Check Now
Run an on-demand DNS check for a domain at any time, on any plan. Results update the health card and score immediately.
Scheduled monitoring
Protect+Automatic checks with change alerts. The fastest cadence is set by your plan: Protect every 24 hours, Growth every 12, Professional and Partner every 6, Enterprise hourly. Monitor is manual-only.
TLS ReportsProtect+
TLS-RPT (RFC 8460) reports reveal TLS negotiation failures between sending mail servers and your domain, helping you find and fix encryption issues:
Report analysis
- Policy-level success and failure counts
- Failure type breakdown (certificate, STARTTLS, DANE)
- Sending MTA and receiving MX identification
- Per-policy detailed failure reasons
- Reporting organization metadata
- Trend analysis across reporting periods
Failure types
Categorizes failures such as certificate-expired, certificate-host-mismatch, starttls-not-supported, and sts-policy-invalid, per RFC 8460.
Forensic ReportsProtect+
Forensic (RUF) reports describe individual failed messages. There is no sidebar entry — open them from the Forensic Reports (RUF) card on the Failures page, or with the command palette.
What's included
- Source IP with country, ASN, and ASN organization
- Original mail-from and rcpt-to addresses
- The full Authentication-Results header, parsed
- A redacted sample of the original message headers
- Failure type and reported domain
- Delivery result applied by the receiver
Privacy note
Forensic reports can contain personal data. DDMARC drops tracking-oriented headers, caps how many headers and how much of each it stores, and puts the results behind role-based access control. See Forensic Reports for exactly what is kept.
ExportsProtect+
Three CSV exports are available for offline analysis and compliance reporting:
DMARC Reports
Report records with authentication results, source IPs, and disposition.
Senders
Sender data with categories, pass rates, geolocation, and notes.
Activity Log
Audit trail with timestamps, actions, users, and IP addresses.
Filtering & search
Use the controls at the top of each page to narrow what you are looking at:
Date range
Last 7, 14, 30, or 90 days, plus this/last week, this/last month, this/last quarter, and year to date.
Filters
Scope to a single domain, or filter by result type, reporter, or sender category depending on the page.
Search
Search by domain name, IP address, ASN organization, or reporter name.
Features by plan
Self-serve tiers. Managed service providers also have Partner Starter ($119/mo) and Partner ($299/mo), both metered by customer domain count.
Monitor
Free
- 2 domains
- 30-day data retention
- Basic analytics
- Manual DNS checks only
- Email reports
Protect
$29/mo
- 5 domains
- 1-year data retention
- Advanced analytics & DNS trends
- Scheduled DNS checks (every 24h)
- TLS-RPT reports
- Forensic (RUF) reports
- CSV exports
- Slack & Discord alerts
- Alert rules + API access
Growth
$69/mo
- 15 domains
- 1-year data retention
- Everything in Protect
- Scheduled DNS checks (every 12h)
- Managed MTA-STS & BIMI hosting
- ARC chain monitoring
- Telegram & Teams alerts
- Team collaboration
Professional
$99/mo
- 25 domains
- 1-year data retention
- Scheduled DNS checks (every 6h)
- Custom DKIM selectors
- Policy rollout automation
- Lookalike domain detection
- AI posture explainer
- Compliance reports & bulk-sender matrix
- Priority support
Enterprise
- Unlimited domains
- Custom data retention
- Hourly scheduled DNS checks
- SSO/SAML
- 99.99% uptime SLA
- White-label options
Annual billing: 3 months free on Protect, Growth and Professional — you pay for 9 months and get twelve. Partner plans are monthly only.